Service Insights Explained
Track service usage and interpret outcomes across your service
Insights gives a service-level view of how Innowell is being used and how clients are changing over time. Managers and lead clinicians have access to both the Overview and Outcomes tabs. Clinicians have access to the Outcomes tab for their own clients.
Getting there
Open the menu behind the hamburger button (top-left) and select Insights. Insights opens on the Outcomes tab; use the Overview tab for service-usage panels, and the Monthly / Lifetime selector to change the period.
Outcomes (Recovery Trajectories)
The Outcomes tab shows how clients are changing between their baseline and latest ratings, by domain. Select the Outcomes tab to see Recovery Trajectories.
Reading the bars
Each domain shows the proportion of clients who have Improved, had No Change, or Deteriorated between baseline and latest.
- Improved: moved in a positive direction.
- No Change: steady between baseline and latest.
- Deteriorated: moved in a negative direction; worth a closer look.
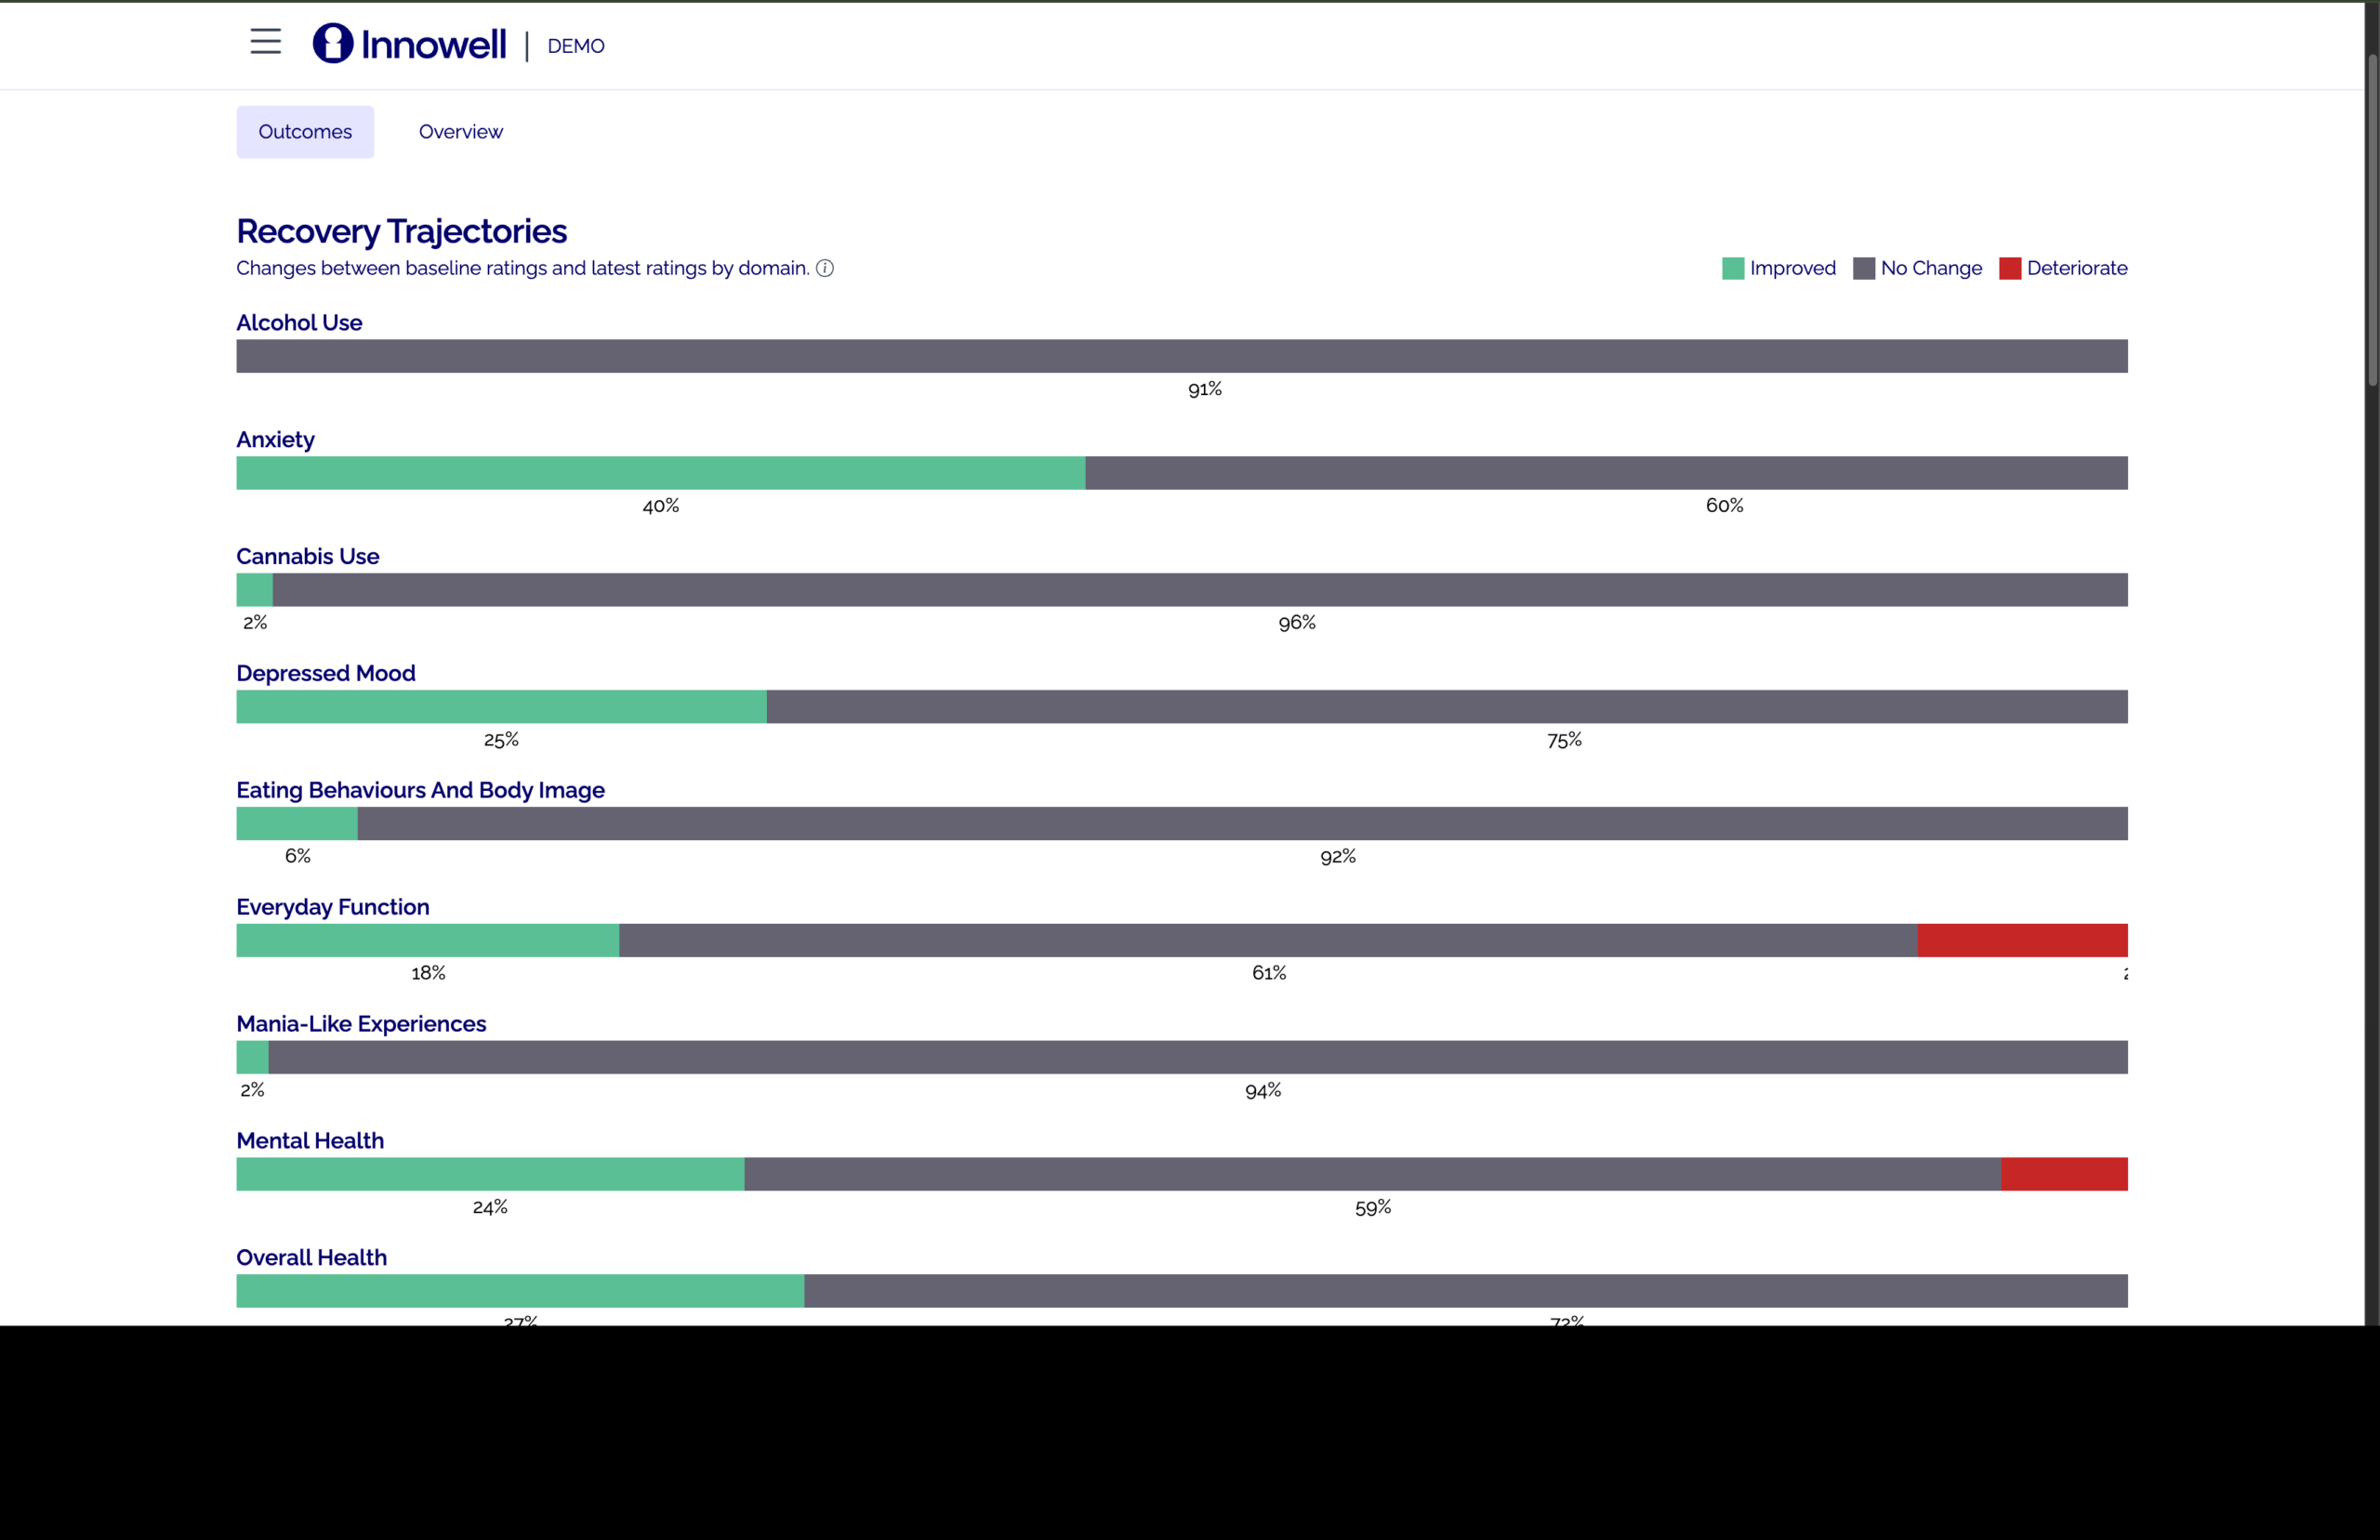
The Recovery Trajectories bars (Improved / No Change / Deteriorated) by domain
These are service-level patterns. They support service review and quality improvement, not individual clinical decisions.
Overview (service usage)
The Overview tab gives a service-level view of how Innowell is being used. Use the Monthly / Lifetime selector to change the period.
What each panel shows
- Individual Onboarding: invitations sent, onboarded, and initial questionnaires completed.
- Individual Sign Ins: how often clients are signing in.
- Summary Questionnaire: completed summary assessments vs unique individuals over time.
- Clinician Sign Ins: clinician activity.
- STB Escalations: escalation volumes over time (service-level trend, not individual response).
A service-level usage view helps managers and leads see how Innowell is being used and where to support adoption.
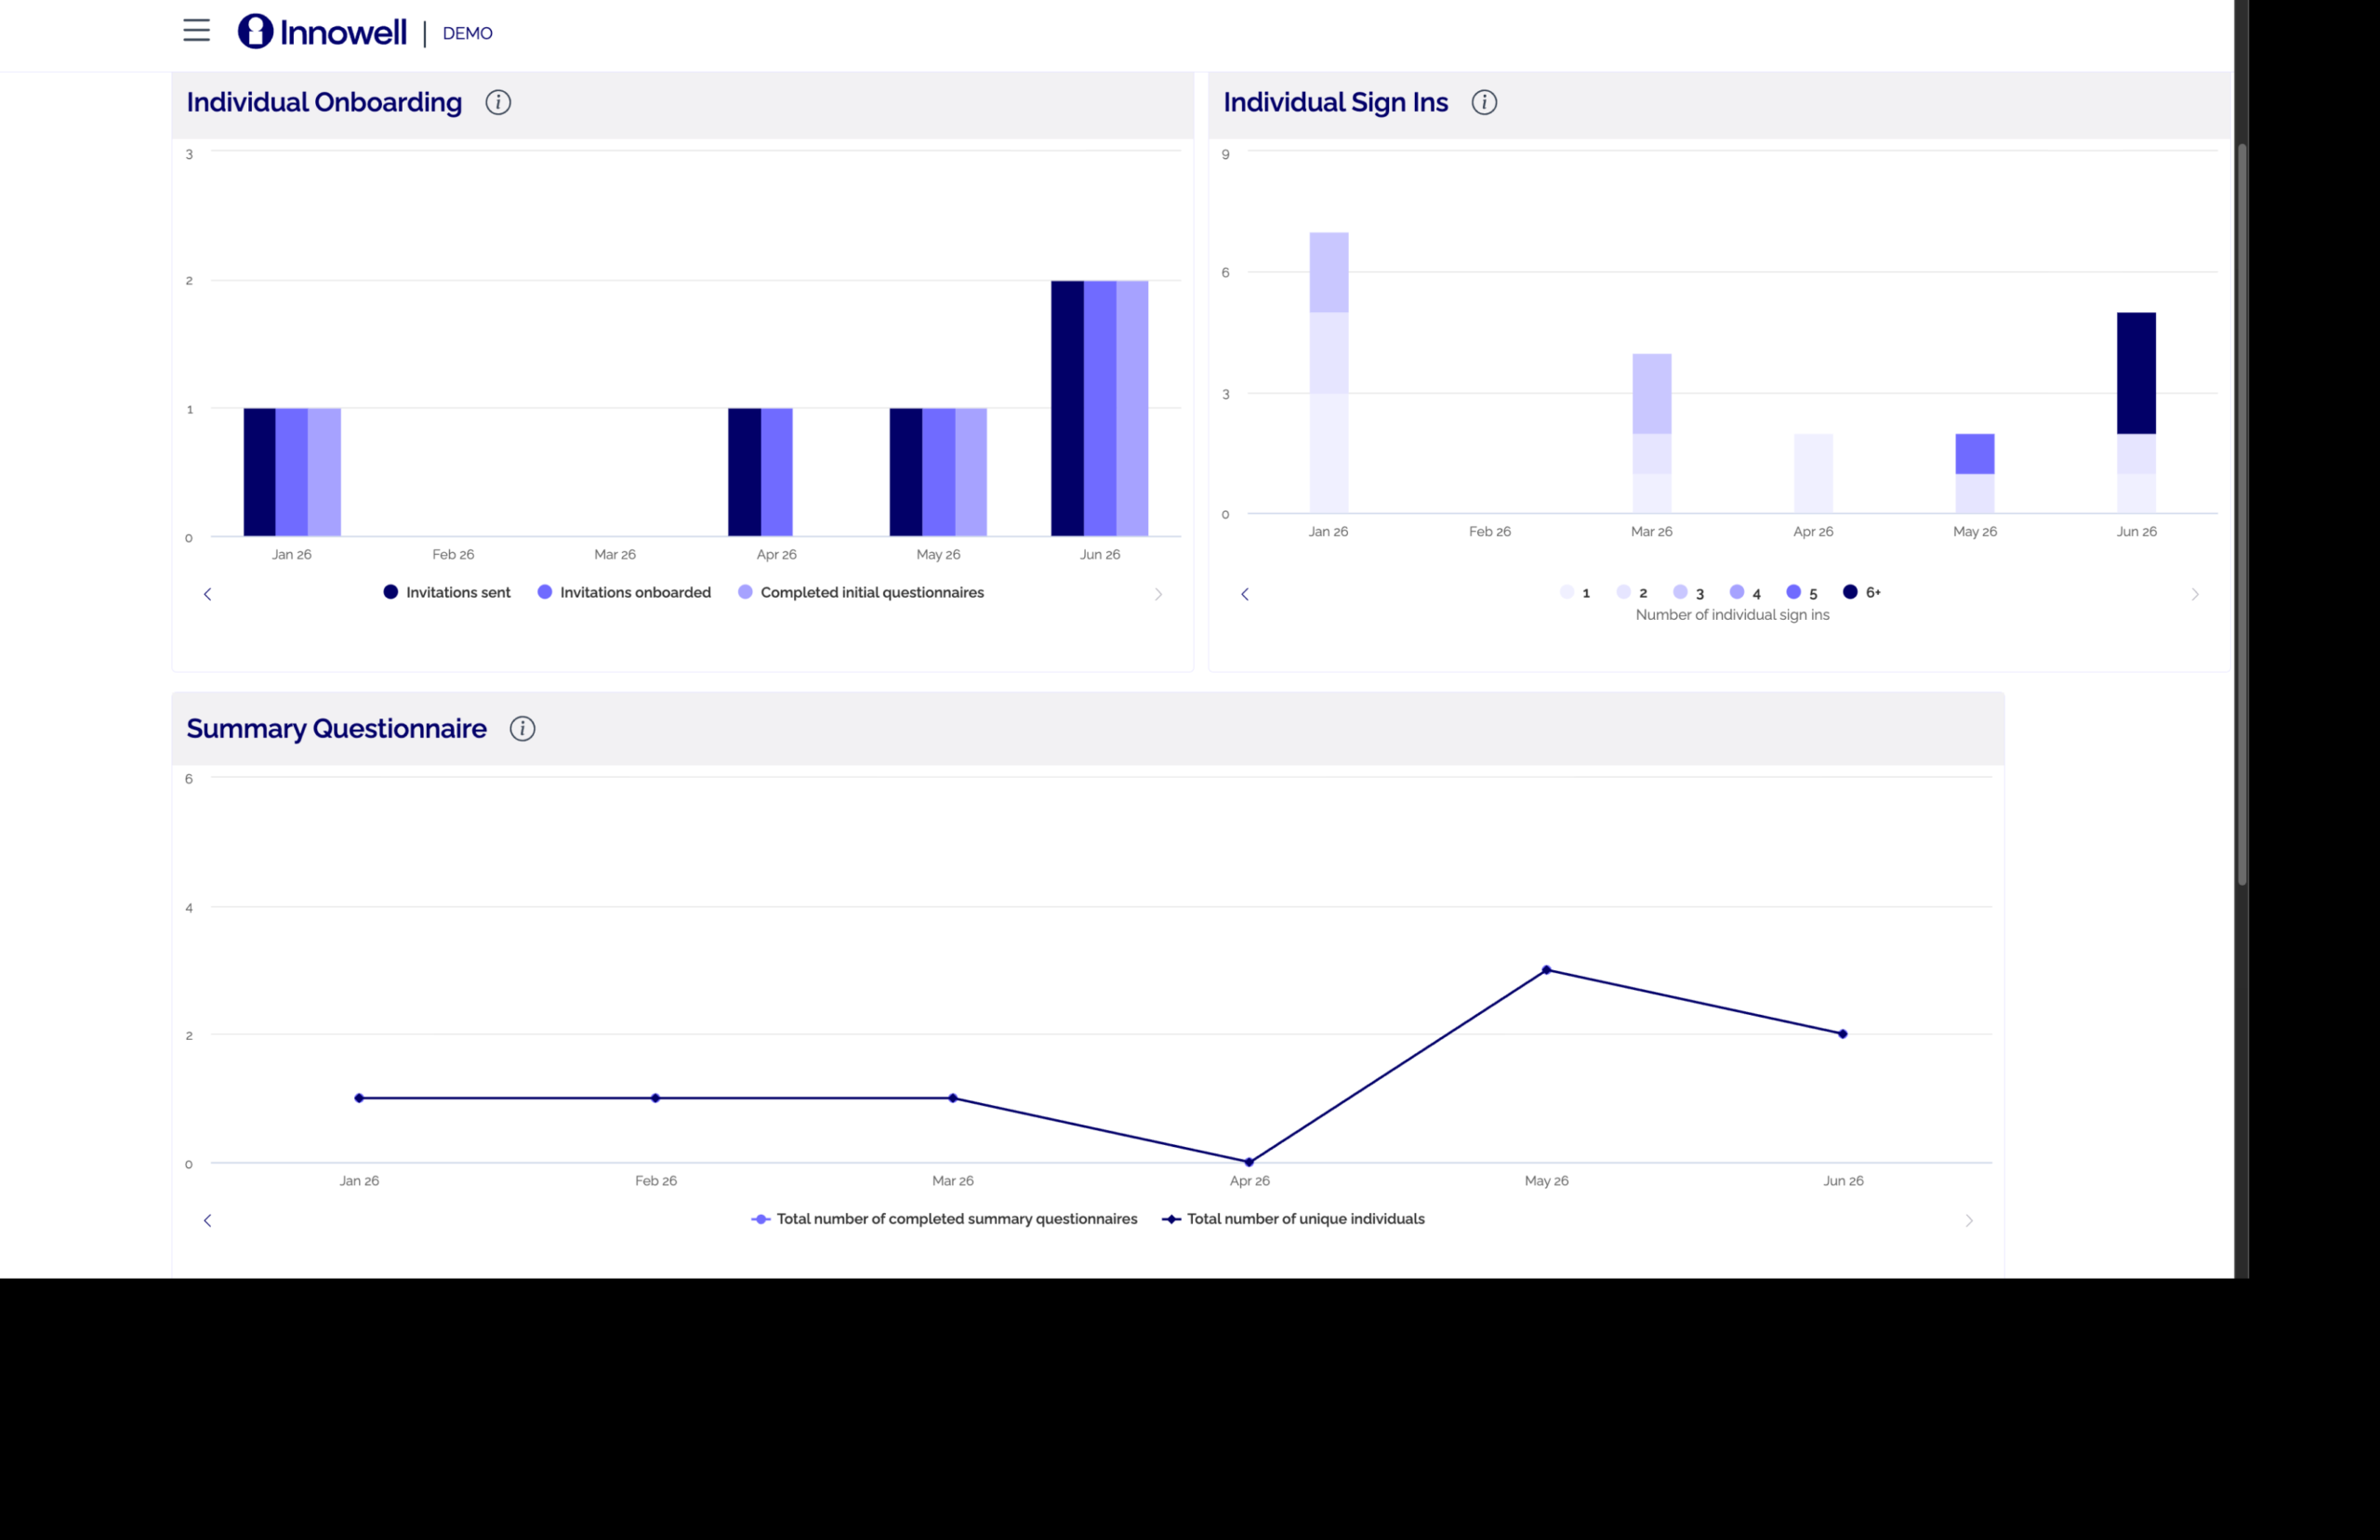
Service-level usage view helps managers and leads see how Innowell is being used and where to support adoption.